Product Design Leader
SiteHero.png

J.P. Morgan Investment Screening Platform


J.P. Morgan Investment Screening Platform

Problem statement

J.P. Morgan’s existing investment screeners were limited by gaps in financial data coverage, basic filtering functionality, list-based results, and desktop-only support. The legacy model relied exclusively on low/high range sliders, offering little flexibility for defining or combining screening criteria. Filtered securities appeared in lists rather than comparative data tables, limiting investors’ ability to evaluate financial metrics side by side.

The challenge was to expand financial data coverage, rebuild the filtering architecture, and introduce responsive, configurable results tables across three distinct screeners: stocks, ETFs, and mutual funds. The new left-rail filtering system needed to accommodate the distinct data attributes and screening requirements of all three asset classes from the outset, while maintaining a consistent framework within each screener. The data tables needed to return financial metrics aligned with the applied screening criteria and allow users to configure visible columns, adapting the experience for desktop, tablet, and the Chase Mobile app.


Overview

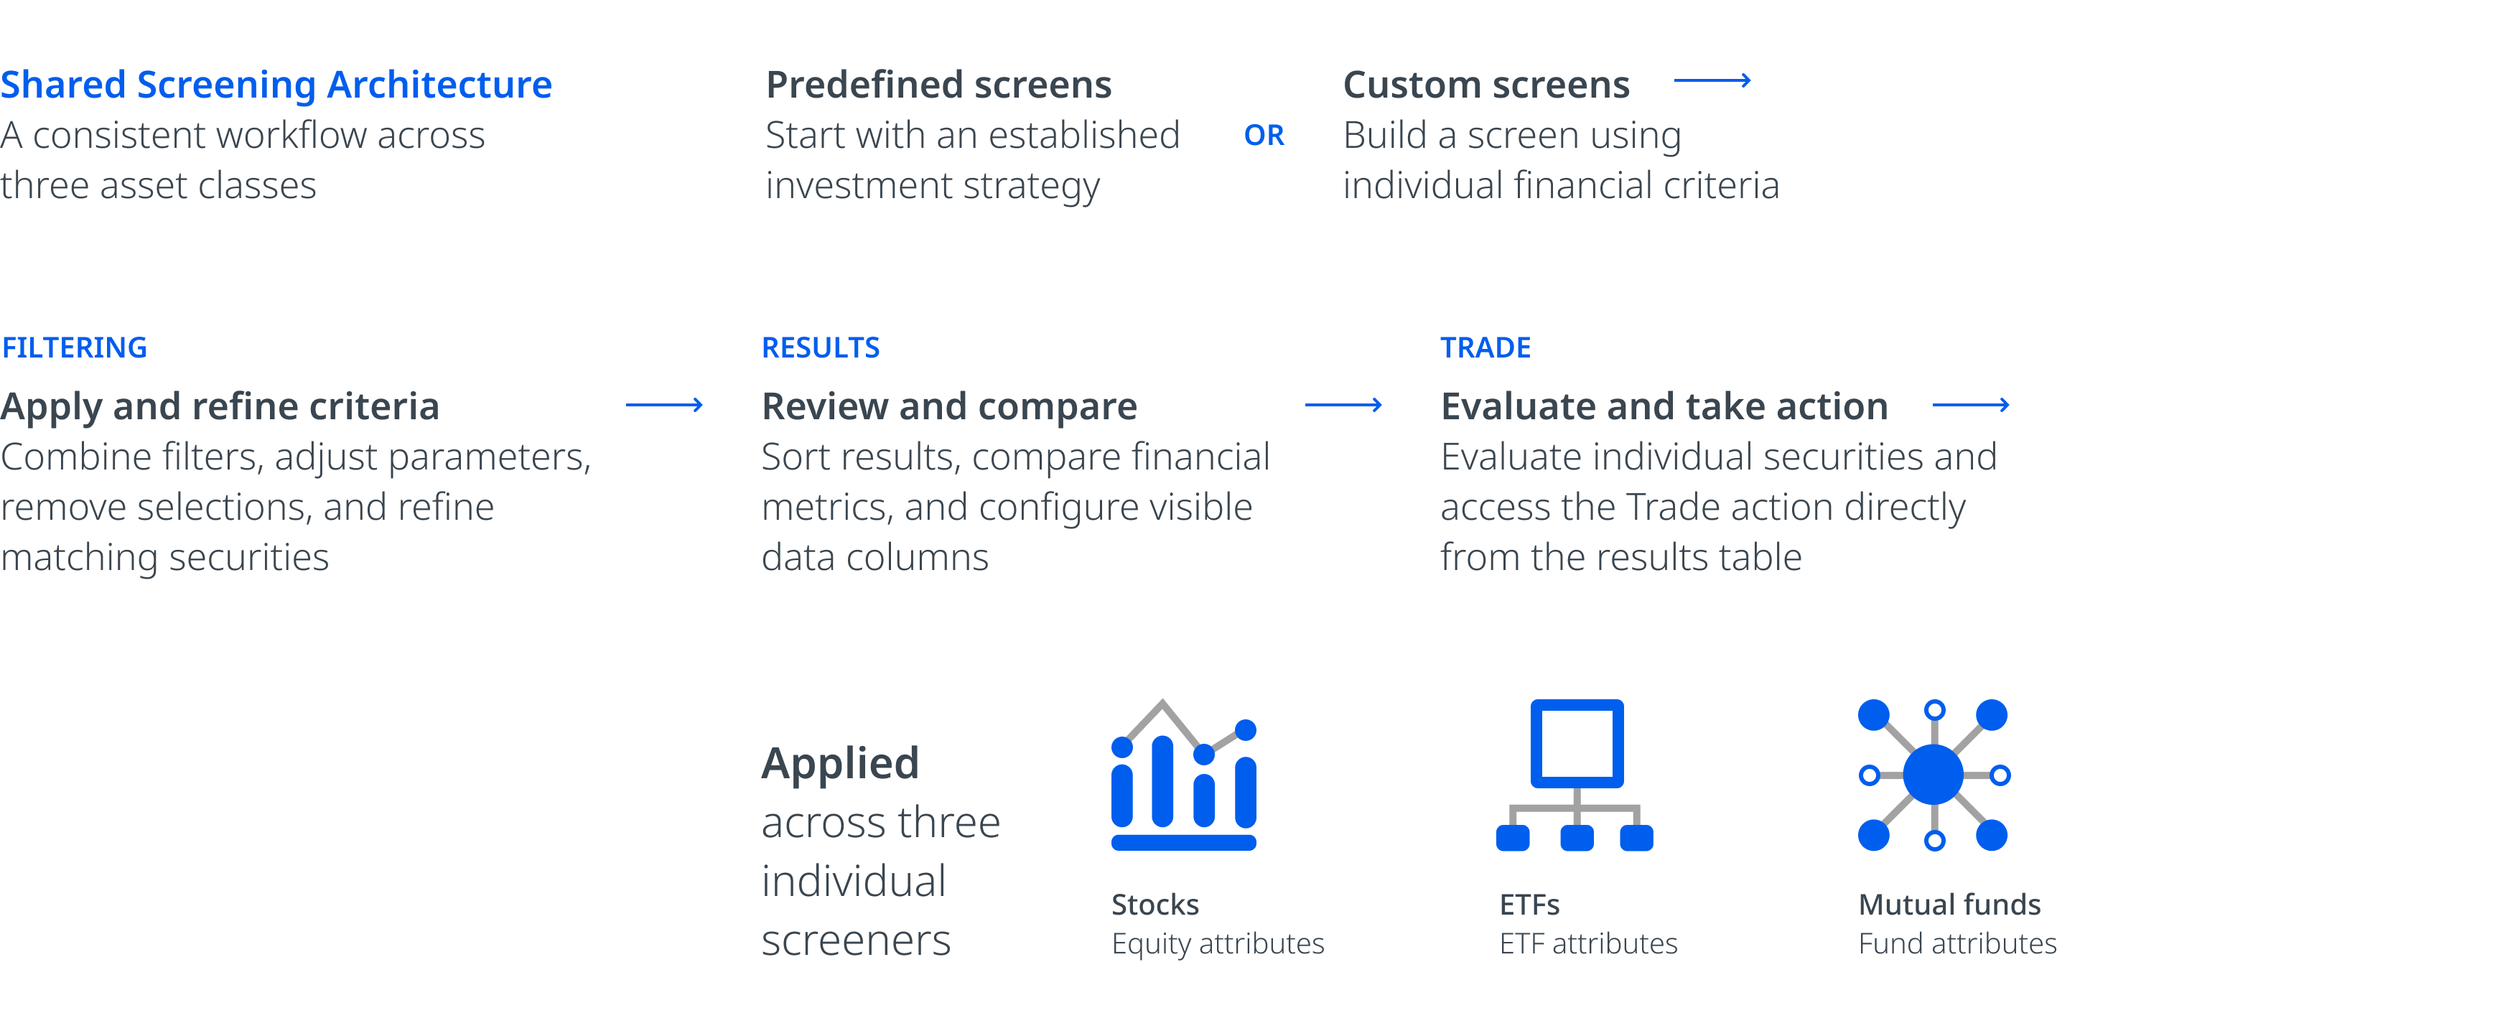
The project delivered a shared investment screening architecture for J.P. Morgan Self-Directed Investing within Asset & Wealth Management. The objective was to establish a unified screening framework capable of serving diverse audiences, from individual self-directed investors conducting personal investment research to enterprise-level brokerage clients with more sophisticated analytical requirements. The platform supported three distinct asset classes—stocks, exchange-traded funds (ETFs), and mutual funds—with screening capabilities tailored to the financial data and requirements of each.

As VP of Product Design, I led the design effort in close collaboration with Product Management, Strategy, Content, Engineering, and Analytics. Fincentric, J.P. Morgan’s financial data partner, provided expertise in sourcing, integrating, and validating financial data across all three asset classes. I translated business, product, and financial data requirements into the screening architecture, interaction model, and UX/UI specifications, aligning design direction with product objectives and engineering implementation.


user context

The screeners served a diverse investment audience, including individual investors, financial analysts, portfolio managers, traders, and institutional investors. These users needed to evaluate a wide range of stocks, ETFs, and mutual funds, apply precise financial criteria, and identify securities aligned with their investment objectives and strategies.

Effective screening depended on accurate, timely, and consistent financial data across asset classes. Users needed to combine financial attributes, define custom thresholds, compare securities across relevant metrics, and save screening configurations for subsequent research. The experience had to support varying levels of investment knowledge and analytical needs while maintaining the precision and data integrity required for investment research and decision-making. A key measure of a successful screening experience was its ability to connect investment research with execution, enabling users to move from discovering and evaluating investment opportunities to initiating trades directly from the results table.

Competitive landscape

For a global financial institution like J.P. Morgan, investment screening brings together market data, financial research, investment discovery, and trade execution. The experience needed to serve audiences ranging from self-directed investors to financial analysts, portfolio managers, traders, and enterprise-level brokerage clients, each with distinct research requirements and investment strategies.

Competitive reviews focused primarily on Fidelity, with Robinhood and Charles Schwab as additional references. The analysis examined how financial attributes were categorized, how screening criteria were selected and combined, and how investment metrics were organized and presented within results tables.

J.P. Morgan’s existing screener was desktop-only, relied exclusively on basic low/high range sliders, and displayed filtered results in lists rather than comparative data tables. Its filtering capabilities and presentation of financial data lagged the competition by a decade. The project required bringing the screening experience up to industry standards, enabling users to apply and combine sophisticated financial criteria, narrow and analyze results across relevant data points, and compare investment metrics side by side. This required distinct screening capabilities and results tables specific to stocks, ETFs, and mutual funds.


DAta and requirements alignment

Fincentric, a financial technology partner specializing in market data and digital investment solutions for financial institutions, collaborated with product design, product management, strategy, and content to define the data requirements for the screening experience. Its role included sourcing, integrating, and validating financial data across stocks, exchange-traded funds (ETFs), and mutual funds.

Through collaborative working sessions, we conducted data discovery and validation, mapped financial attributes to product requirements, assessed available data points, and refined filter logic across asset classes. This required aligning data availability and structure with screening needs while accounting for accuracy, consistency, and interpretability. The goal was to establish a flexible framework for comparison and diverse investment criteria, making complex financial information accessible through a simplified experience.


system gaps and opportunities

Chase.com’s existing design system did not provide an established pattern for filtering at this level of complexity. The challenge was to work within the existing design language while developing a left-rail filtering system capable of supporting the financial data and screening requirements. This required evaluating existing design elements, including typography, color, text hierarchy, form controls, and selection patterns. The next step was determining how to adapt and integrate these elements into the new architecture while preserving established usability, accessibility, and compliance standards.

I defined patterns for selection controls, component states, helper text, buttons, and applied-filter chips. Best-in-class e-commerce experiences from Nike.com and Amazon.com served as references for the overall page architecture, particularly the left-rail filter layout, content organization, and independent scrolling behavior between the filter panel and results area. These layout and interaction conventions informed the responsive grid architecture, establishing how the filtering interface and results table would work together across desktop, tablet, and mobile. This brought proven digital commerce patterns into a more complex financial screening environment.

The work also contributed to J.P. Morgan’s broader design standards. The left-rail filter was developed as a reusable global component in collaboration with the Accessibility team and reviewed with the Design Standards team. For the native app, no established design standards existed for horizontally scrollable results tables, particularly in landscape orientation. I defined the UX/UI behavior, layout requirements, and developer implementation guidance, then submitted the specifications to the Design Standards team for formalization as a reusable pattern.



solutions

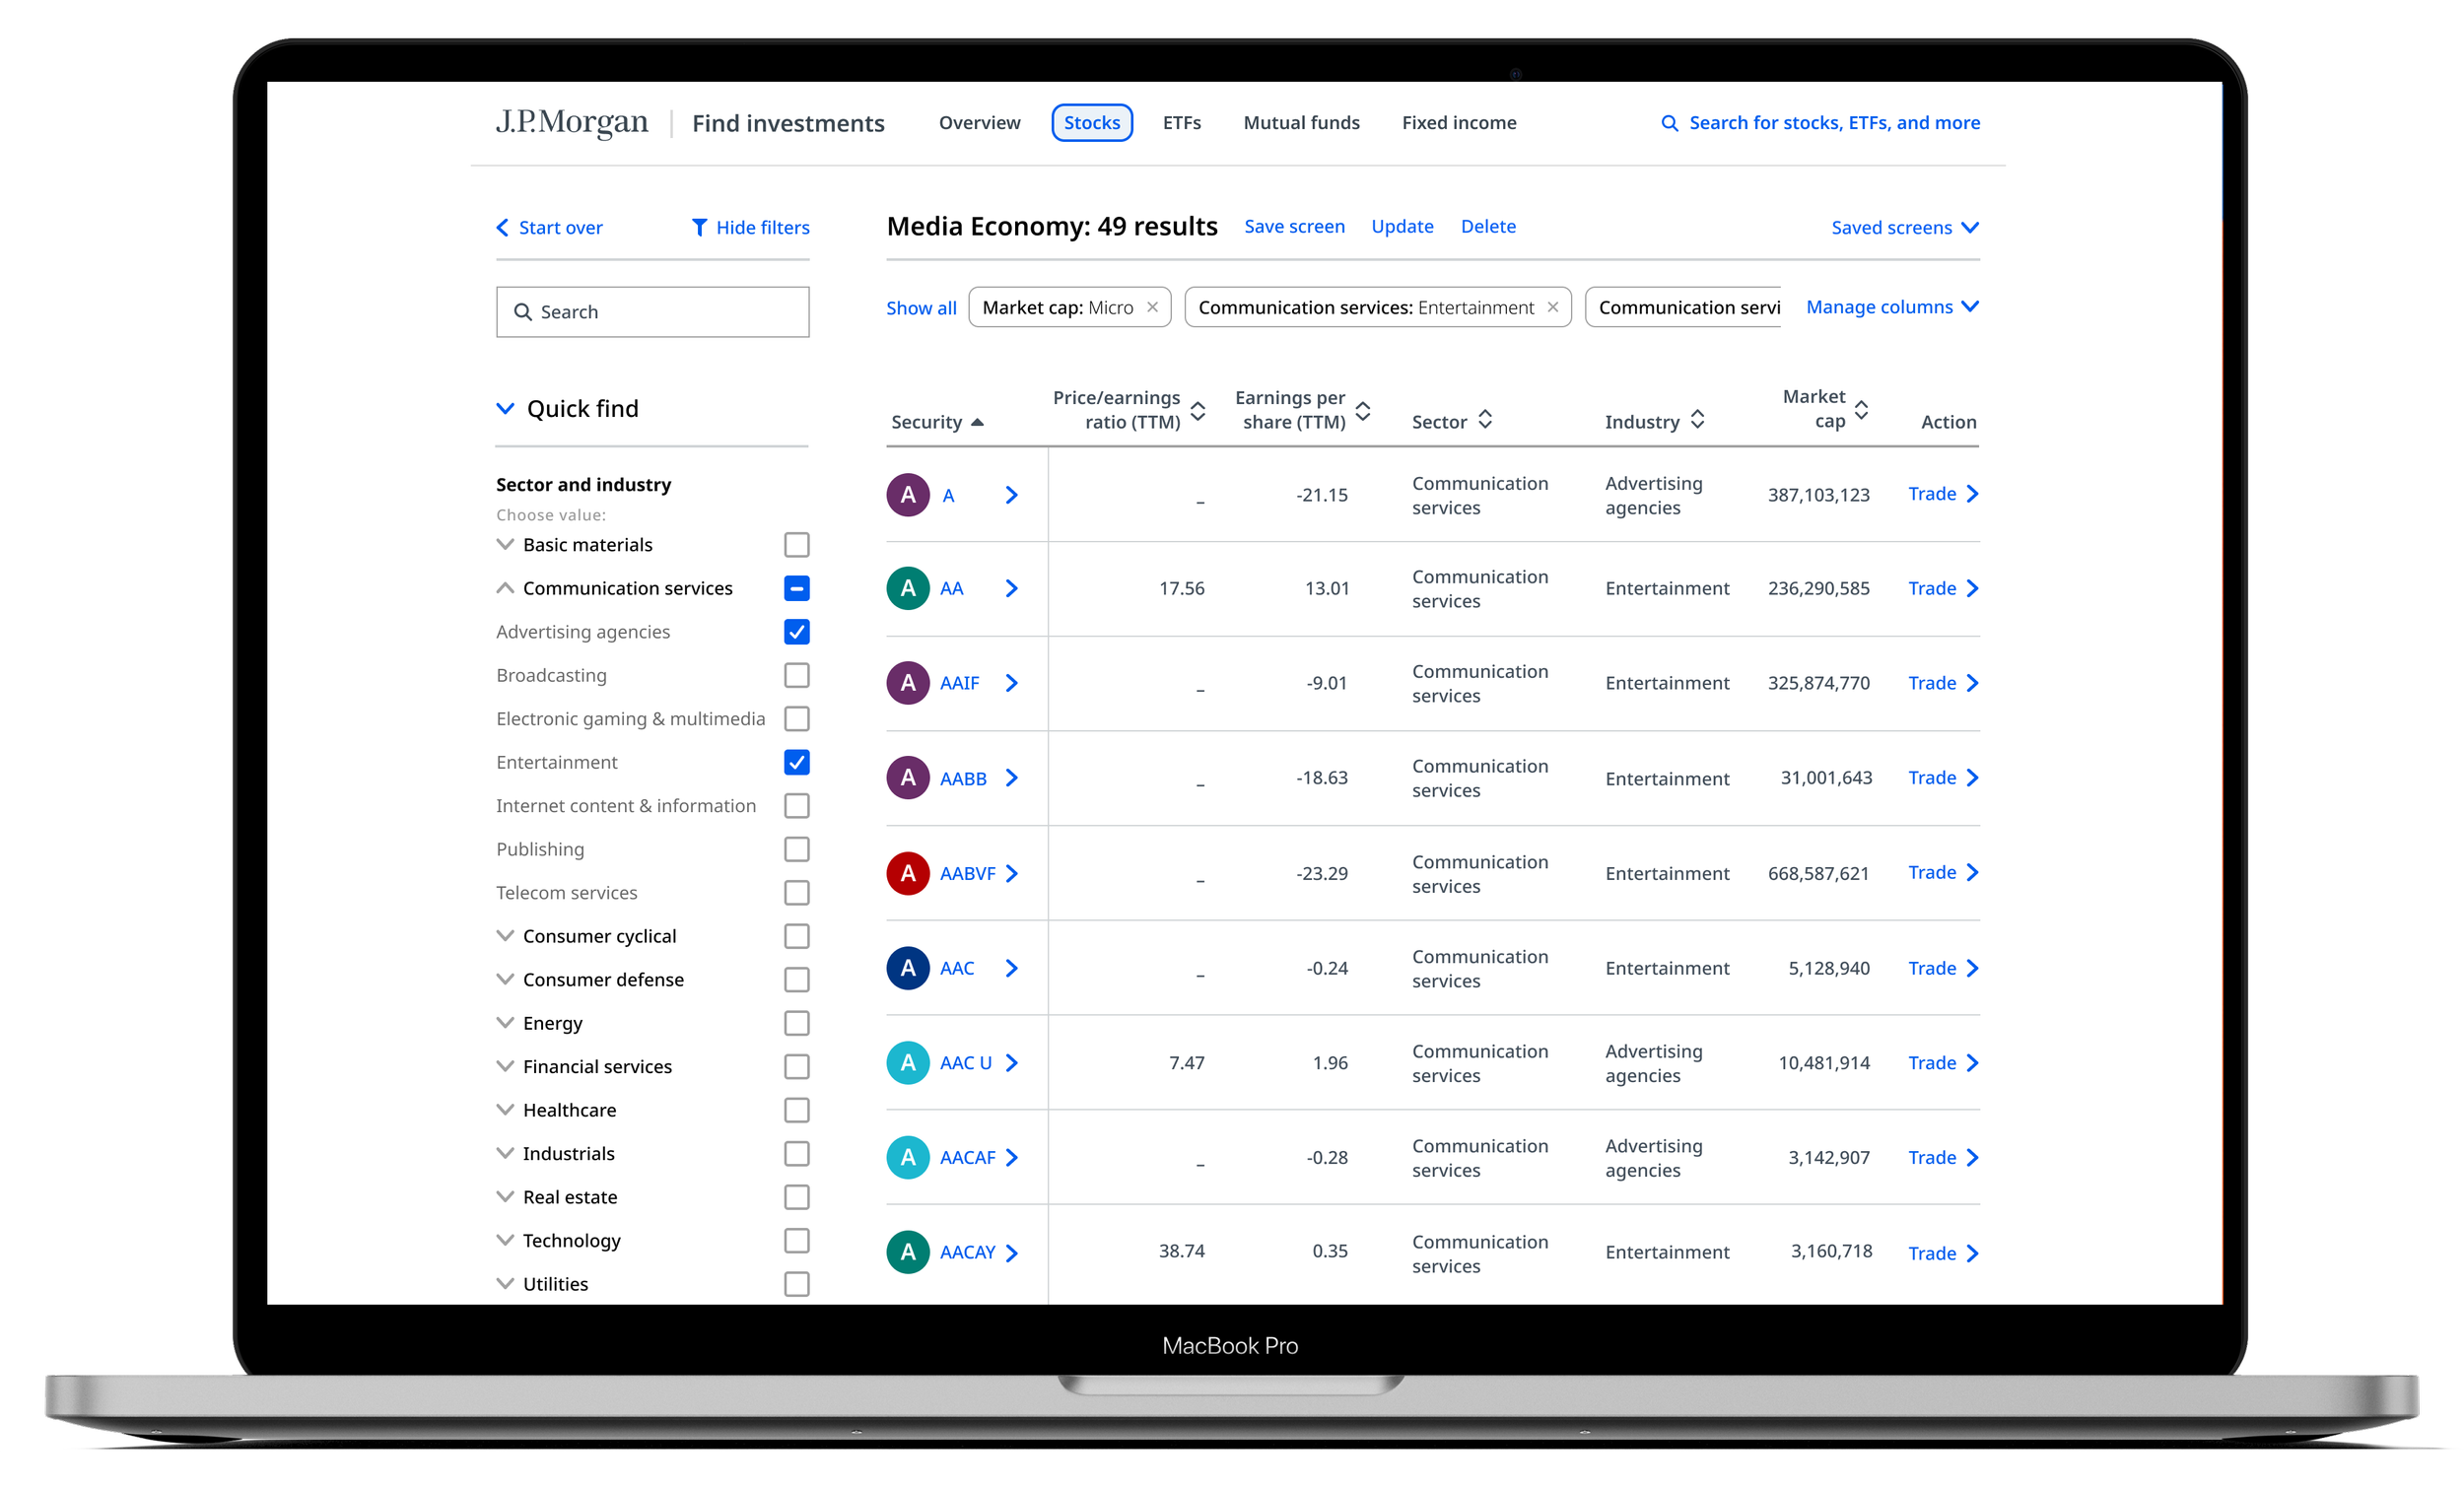
The product delivered an end-to-end investment screening experience within Chase.com, extending the platform’s capabilities across stocks, exchange-traded funds (ETFs), and mutual funds. The experience combined financial data, configurable screening criteria, predefined investment strategies, and comparative results tables within a consistent screening architecture.

The screening framework supported multiple research approaches, from predefined screens based on common investment and trading strategies to custom configurations based on specific financial requirements. Investors could combine criteria, apply financial thresholds, sort and rank matching securities, compare key financial metrics, and configure table columns around their research priorities. Saved screens preserved custom configurations across sessions, allowing users to revisit previous research without rebuilding their criteria. Tooltips and contextual definitions provided additional guidance for understanding financial terminology and interpreting screening data.


iterations

The stock screener was developed first because it had the largest dataset and most demanding requirements. It established the baseline for filter behavior, data handling, results interactions, scrolling, and responsive behavior across desktop, tablet, and the native app. The experience was evaluated and refined in J.P. Morgan’s pre-production environment, where banking security requirements added complexity to deployment. Once stable, the stock screener was released to a limited group of live users, allowing the team to identify and address issues before the broader release. The fully implemented pre-production experience also gave stakeholders a tangible product to share with senior leadership ahead of public release. With the stock screener established, Engineering extended the established implementation and interaction patterns to ETFs and mutual funds, accounting for their distinct financial attributes and screening requirements while reusing the established framework.

Execution

I led design execution from requirements alignment through engineering delivery, translating product objectives and financial data requirements into detailed UX/UI specifications, functional prototypes, and implementation guidance. I participated in project planning and backlog grooming with Product Management and Engineering to review requirements, clarify acceptance criteria, identify dependencies, and determine what additional deliverables were needed. These working sessions aligned design priorities with development plans and resolved open questions before implementation.

I developed end-to-end UX/UI specifications covering screening workflows, interaction behavior, component states, edge cases, error handling, missing-data messaging, and responsive behavior across breakpoints and devices. Design files and functional prototypes established expected behavior and implementation requirements, providing Engineering with a shared reference for consistent implementation across desktop, tablet, and the native app. I worked with native mobile developers to define the requirements for the results table’s horizontal landscape view. Because the existing native component supported only vertical orientation, I calculated the layout requirements, validated grid constraints, and documented the implementation specifications for submission to the Design Standards team.

Reducing User Friction

The team reviewed Excel-based customer-service logs to identify unmet user needs, functionality gaps, and sources of friction across Wealth Management’s website and native app. Each team member investigated issues within their assigned product area. Findings were reviewed with senior design leadership, stakeholders, and Product Management, with requirements prioritized according to impact and importance.

Behavioral Analytics and User Journeys

Strategy conducted user research using functional prototypes to evaluate whether users could understand and navigate the redesigned screening experience. Because historical behavioral data from the legacy screener was limited, we worked with the analytics team to assess available records and define the user-journey data to capture following rollout. Success evaluation focused on progression from defining screening criteria to reviewing filtered results and initiating a trade. With the [Trade] call to action embedded directly in the results table, the analytics framework established a foundation for tracking progression toward trade initiation.


Filter Taxonomy and Information Architecture

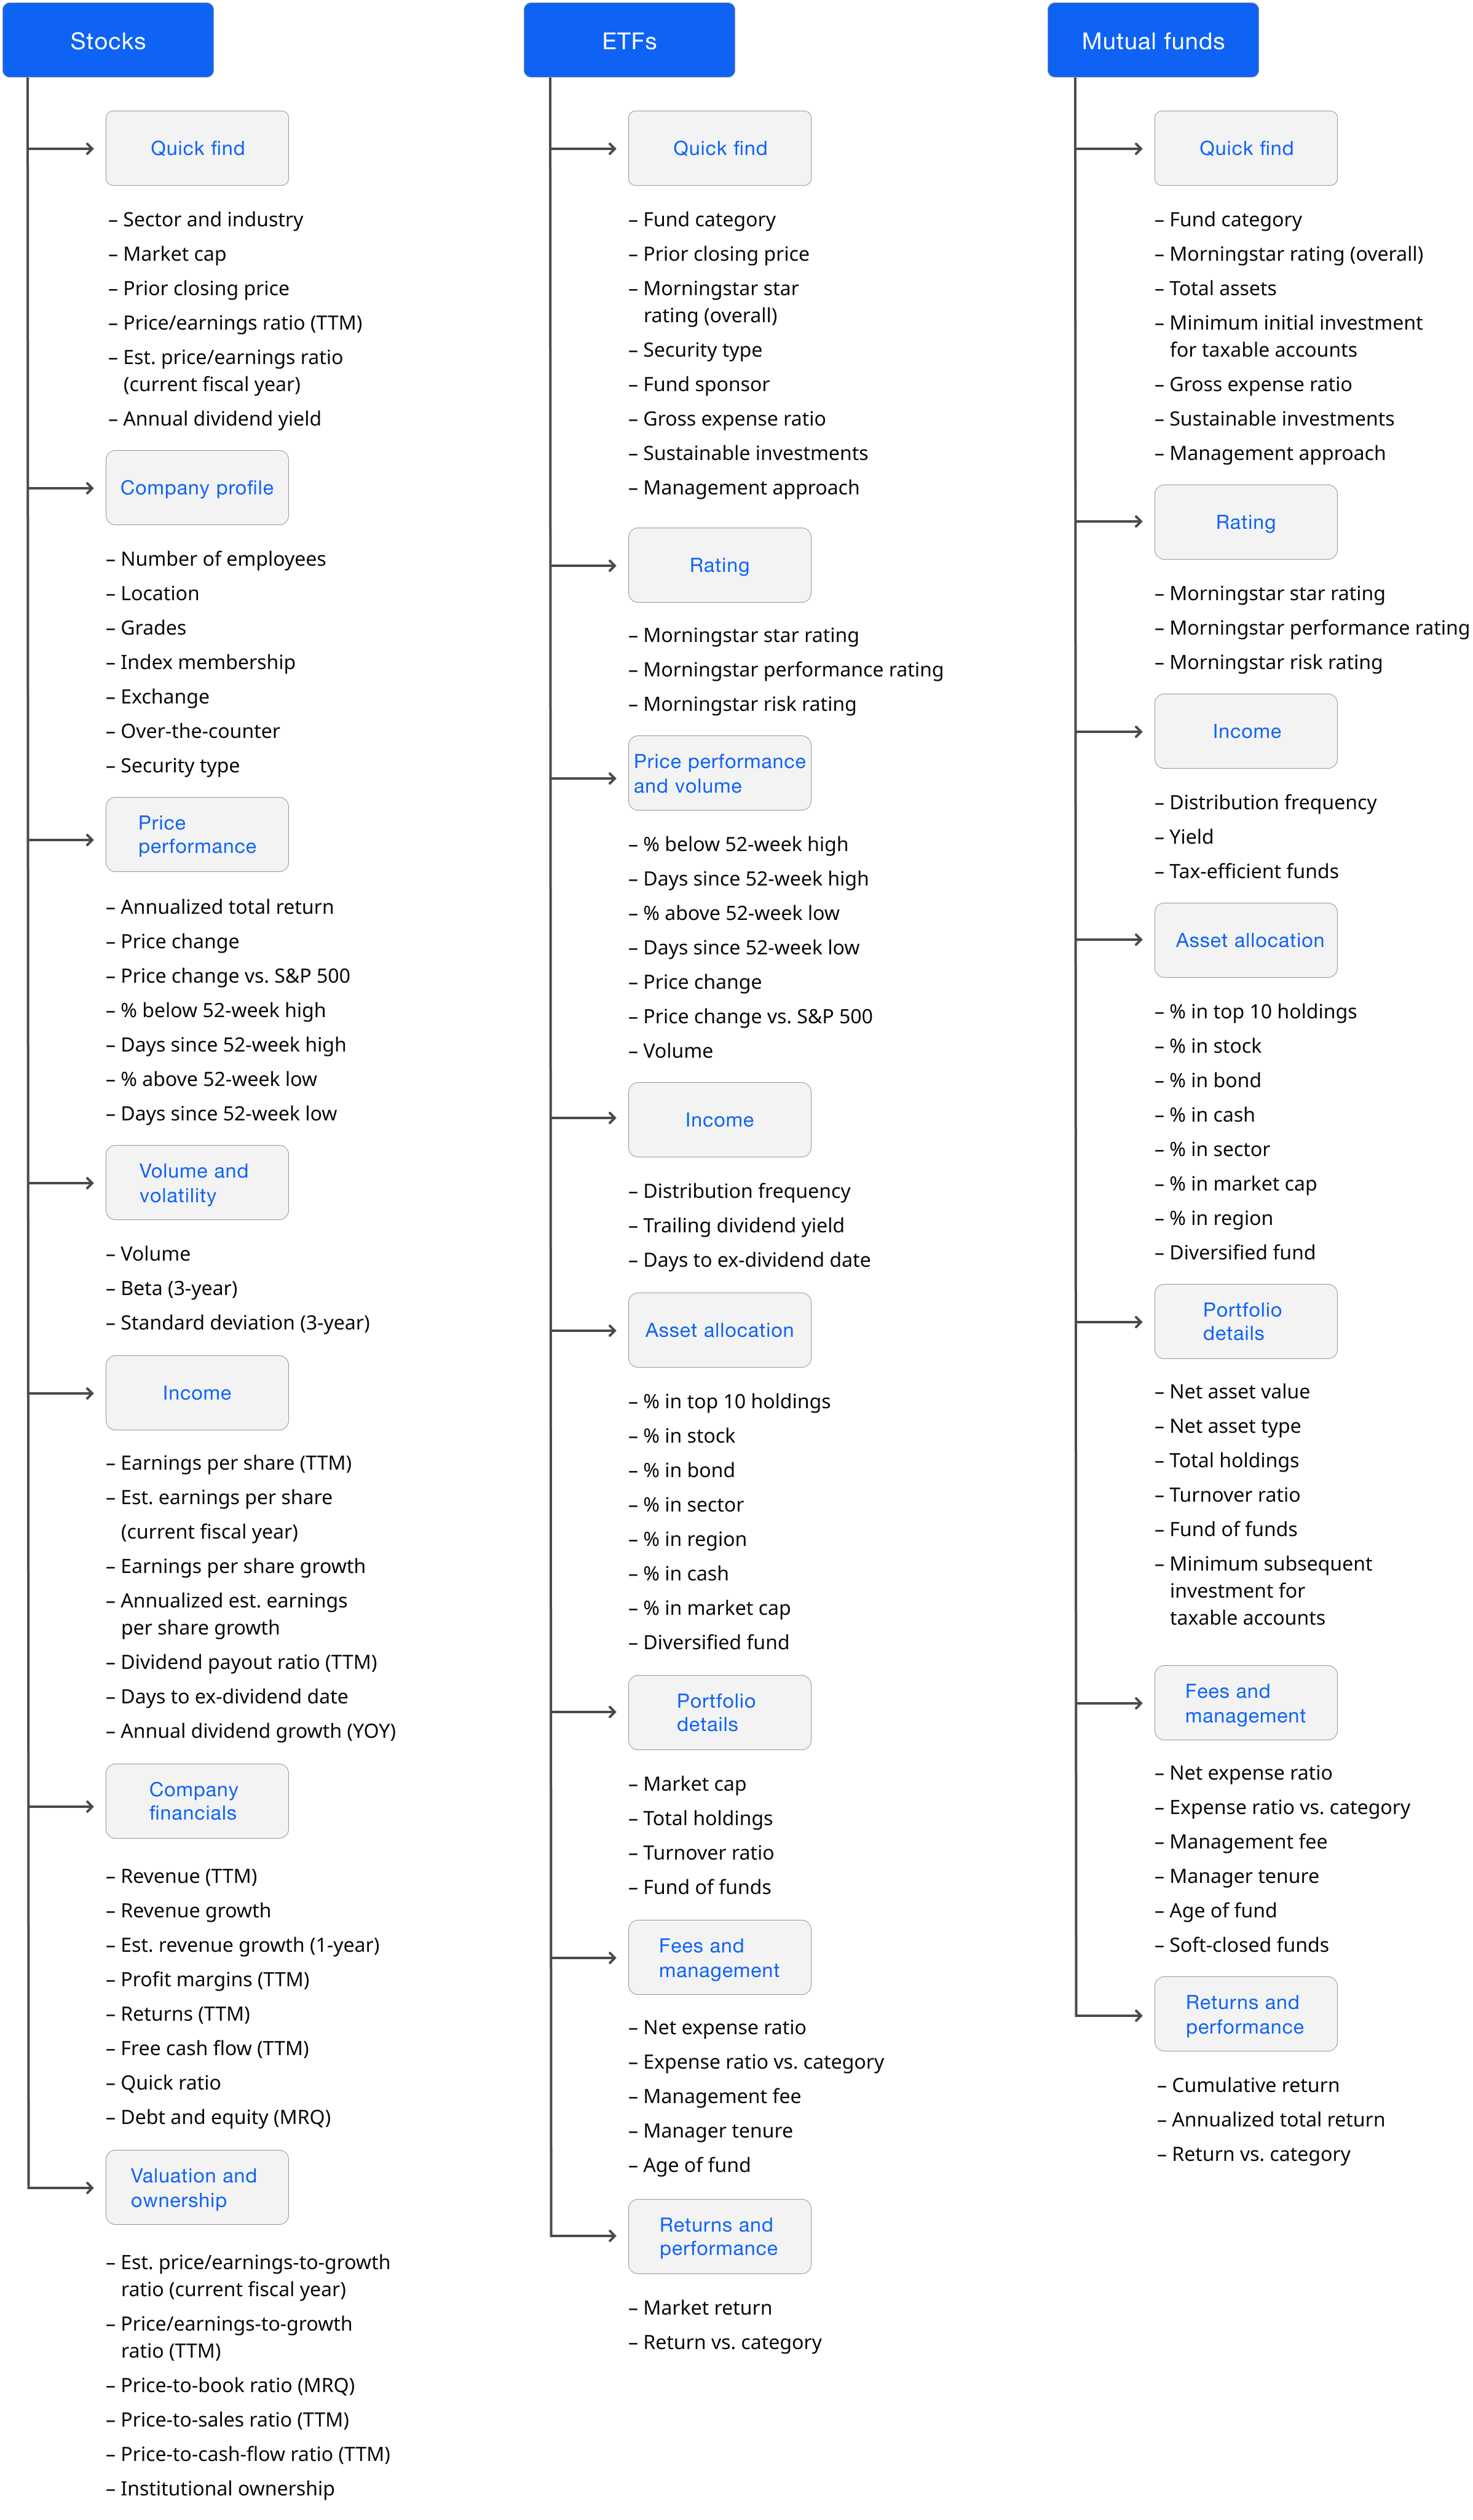
The filtering architecture needed to accommodate distinct financial attributes and screening requirements across stocks, ETFs, and mutual funds. Together the team evaluated available data attributes, organized them into meaningful filter categories, and structured the filtering experience. A key challenge was establishing a consistent, scalable taxonomy across all three screeners while accounting for distinct data attributes. The resulting framework reflected industry conventions, customer needs, competitive benchmarks, and usability considerations, while maintaining consistent organization and interaction patterns across each asset class.

Filtering Interaction Model and Dynamic Results

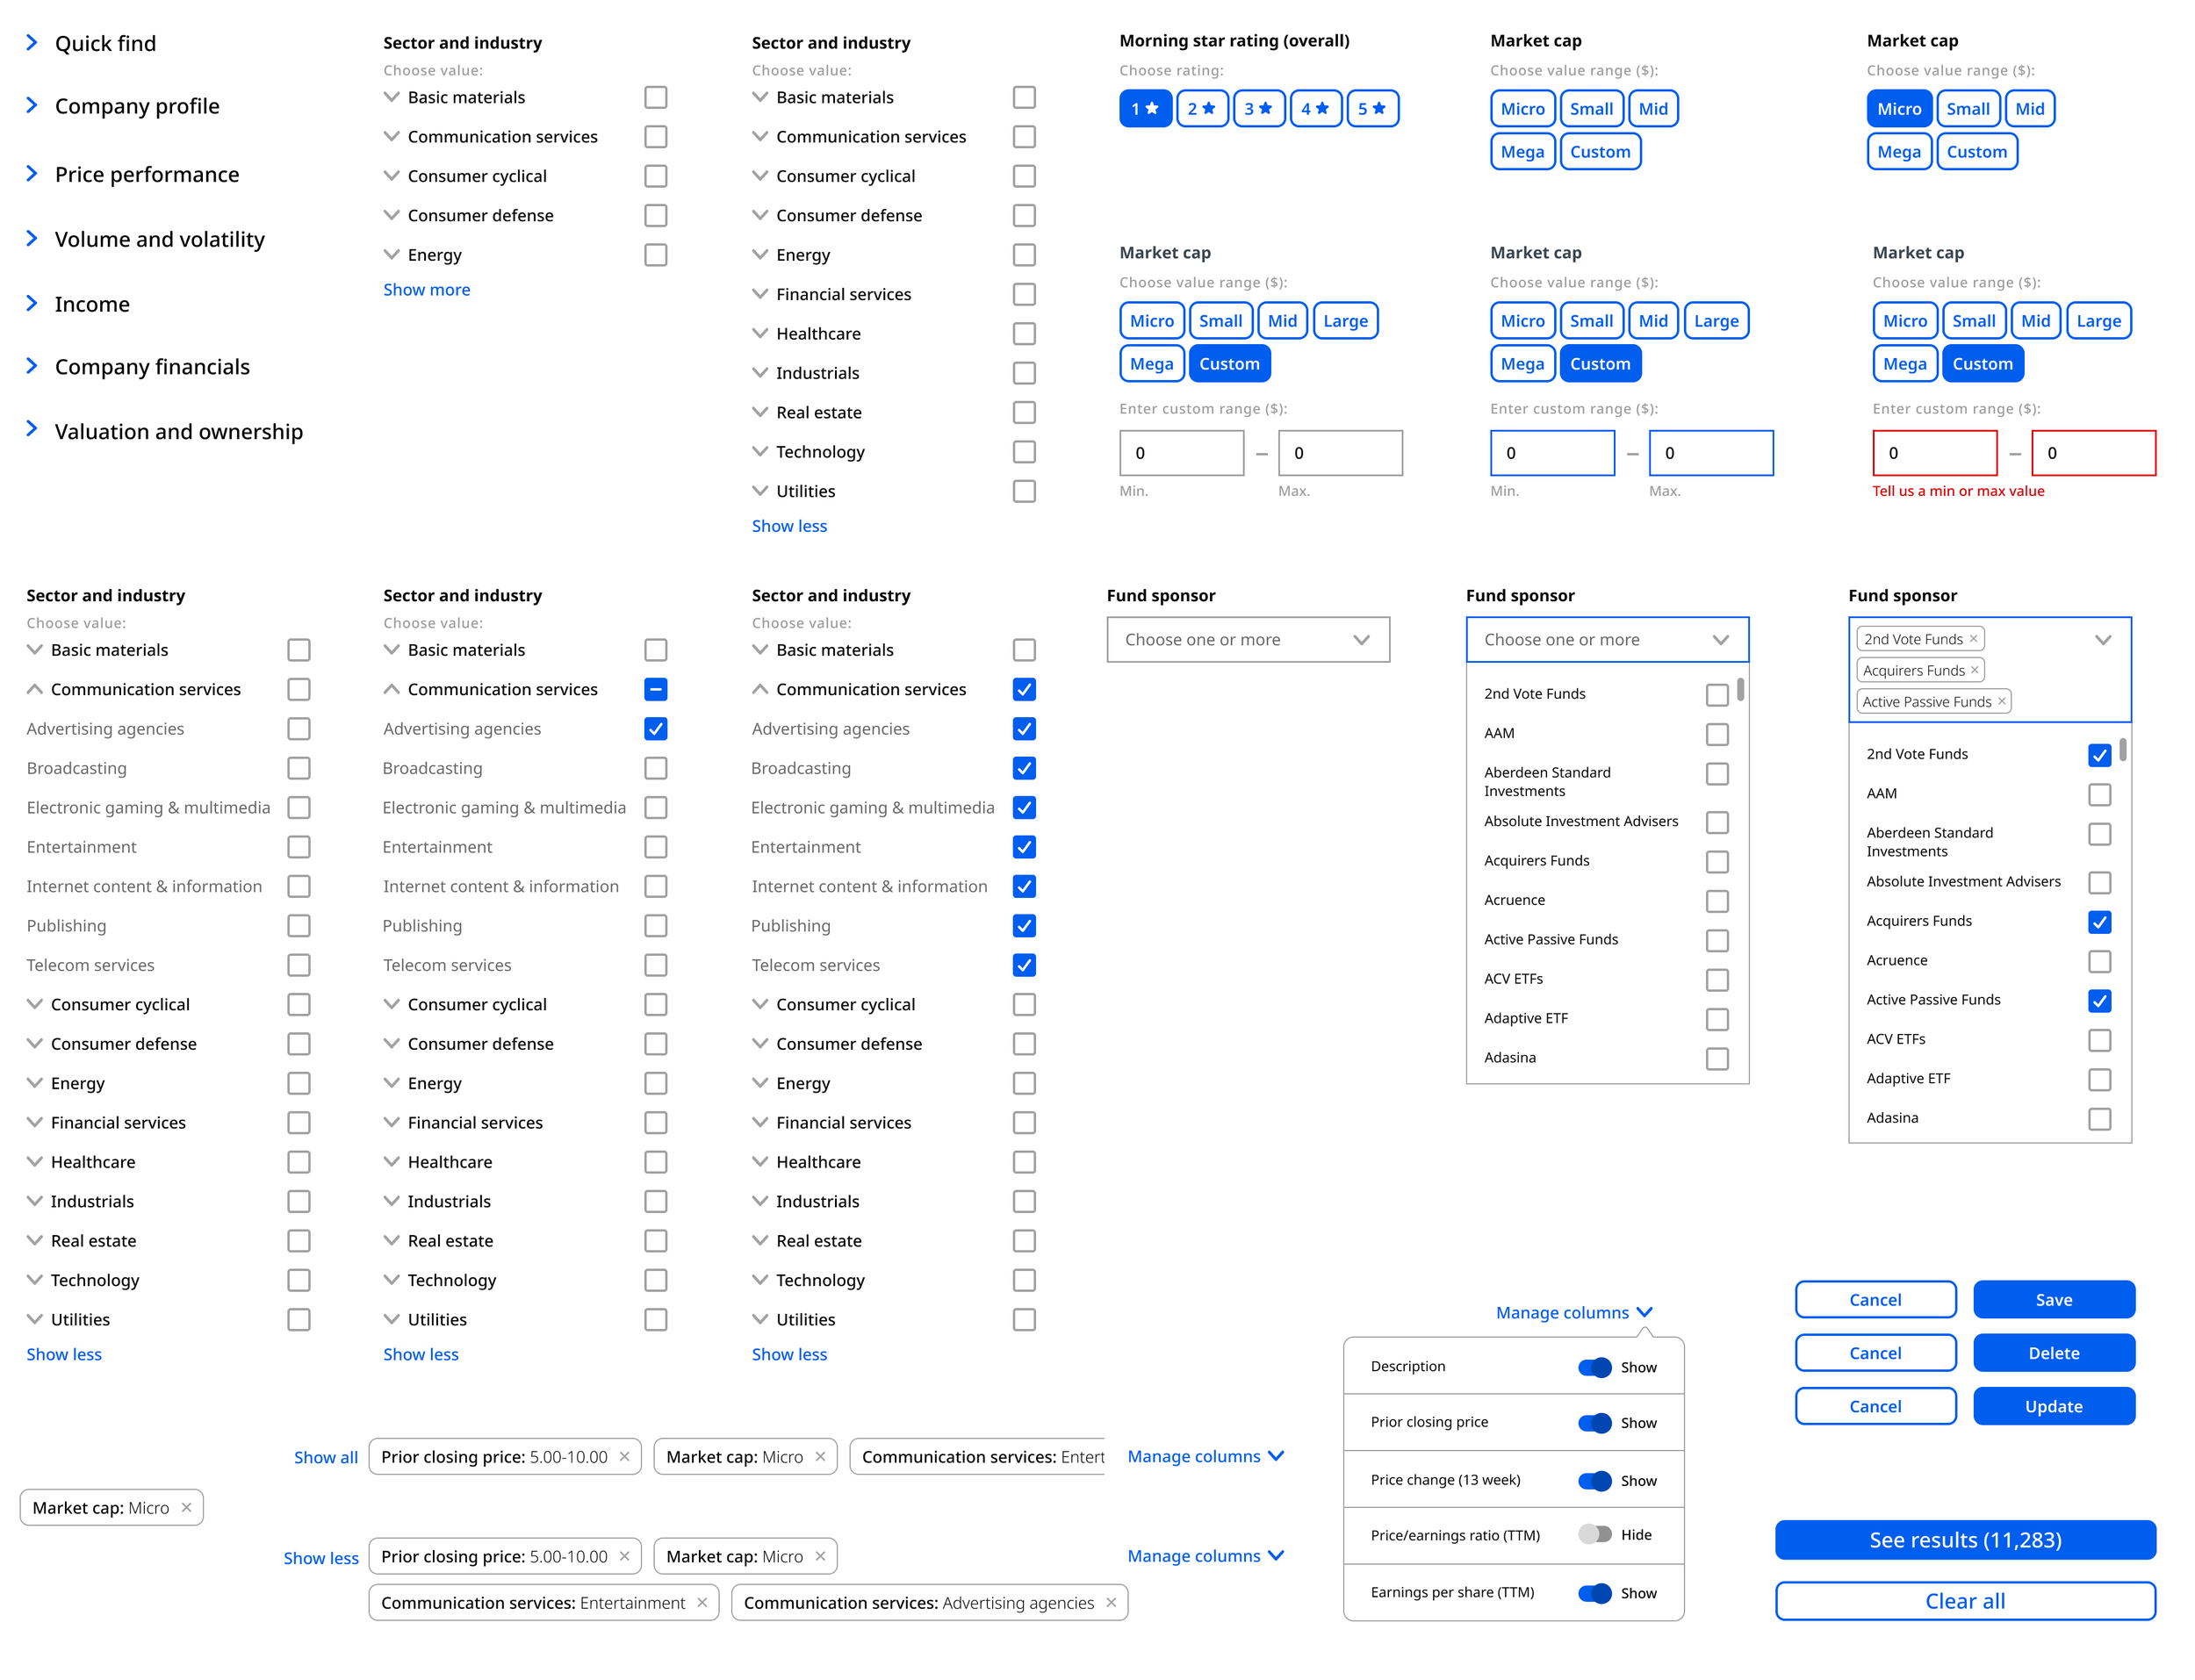
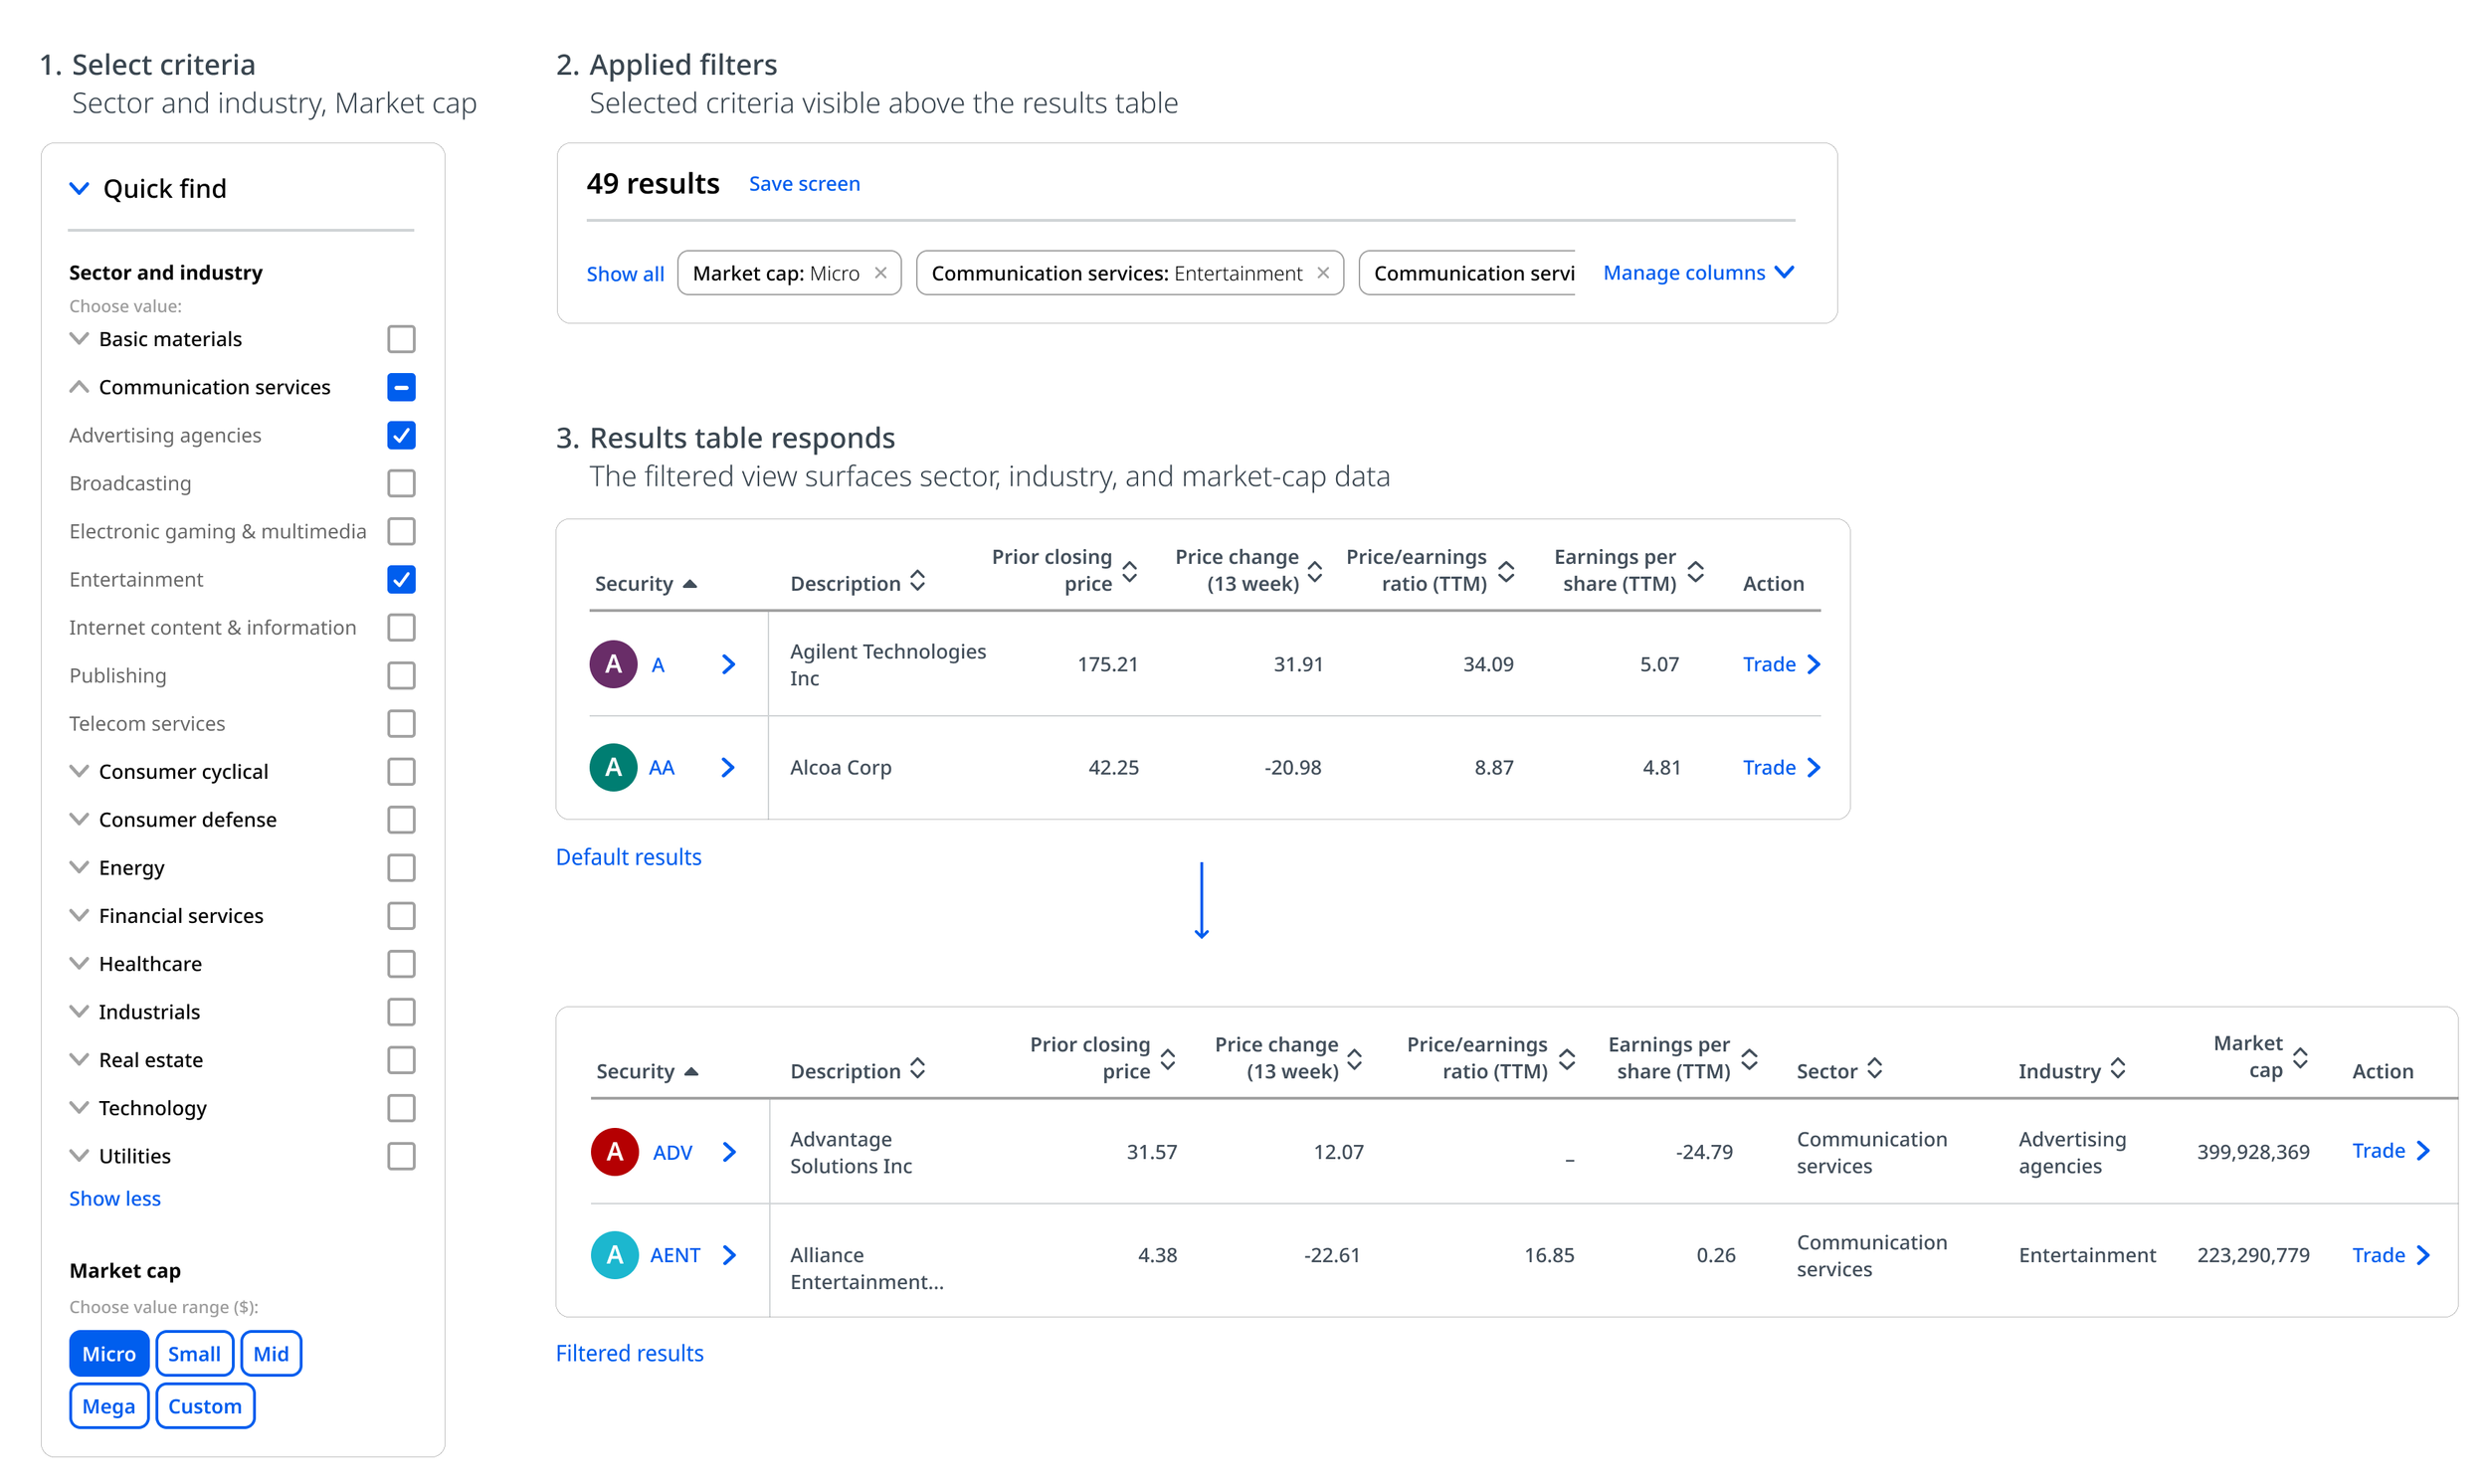
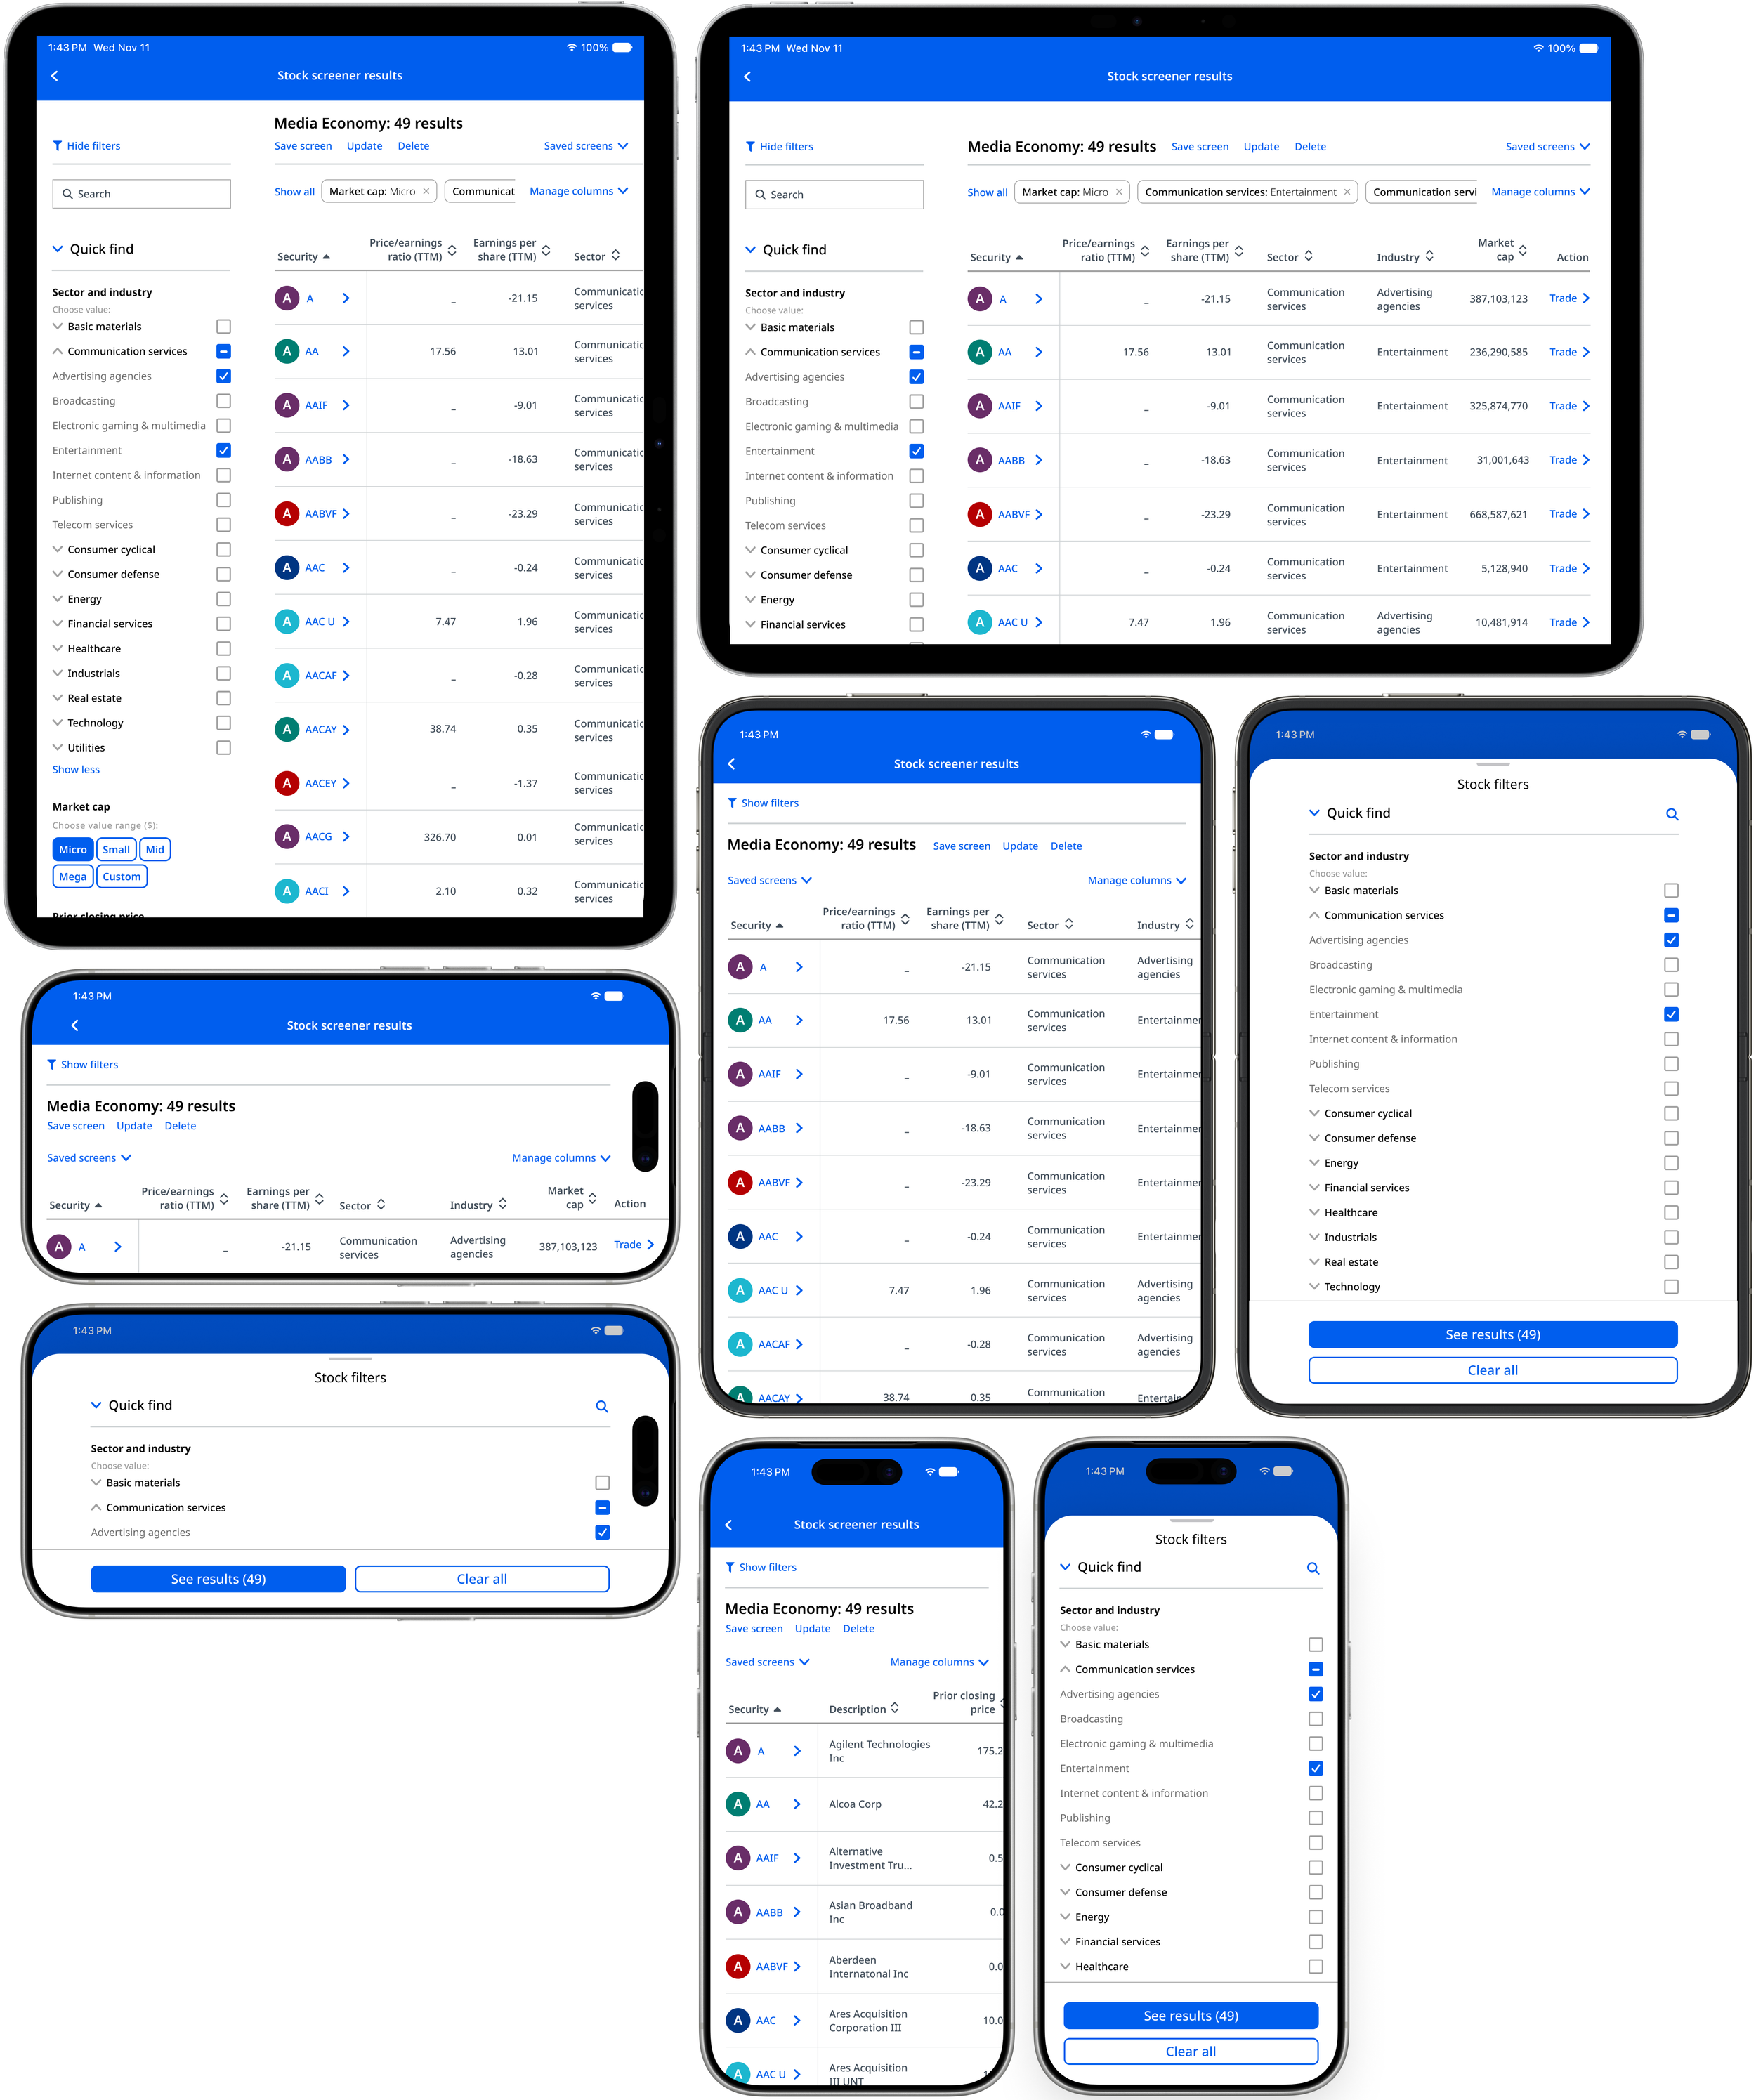
The screening experience supported multiple filtering methods, including checkboxes, dropdowns, predefined ranges, and custom numeric inputs, allowing users to combine criteria and apply precise screening parameters. On desktop, results updated automatically as filters changed. On tablet and mobile, filters appeared in an overlay panel, with a [Results] button displaying the matching count before returning users to the results table.

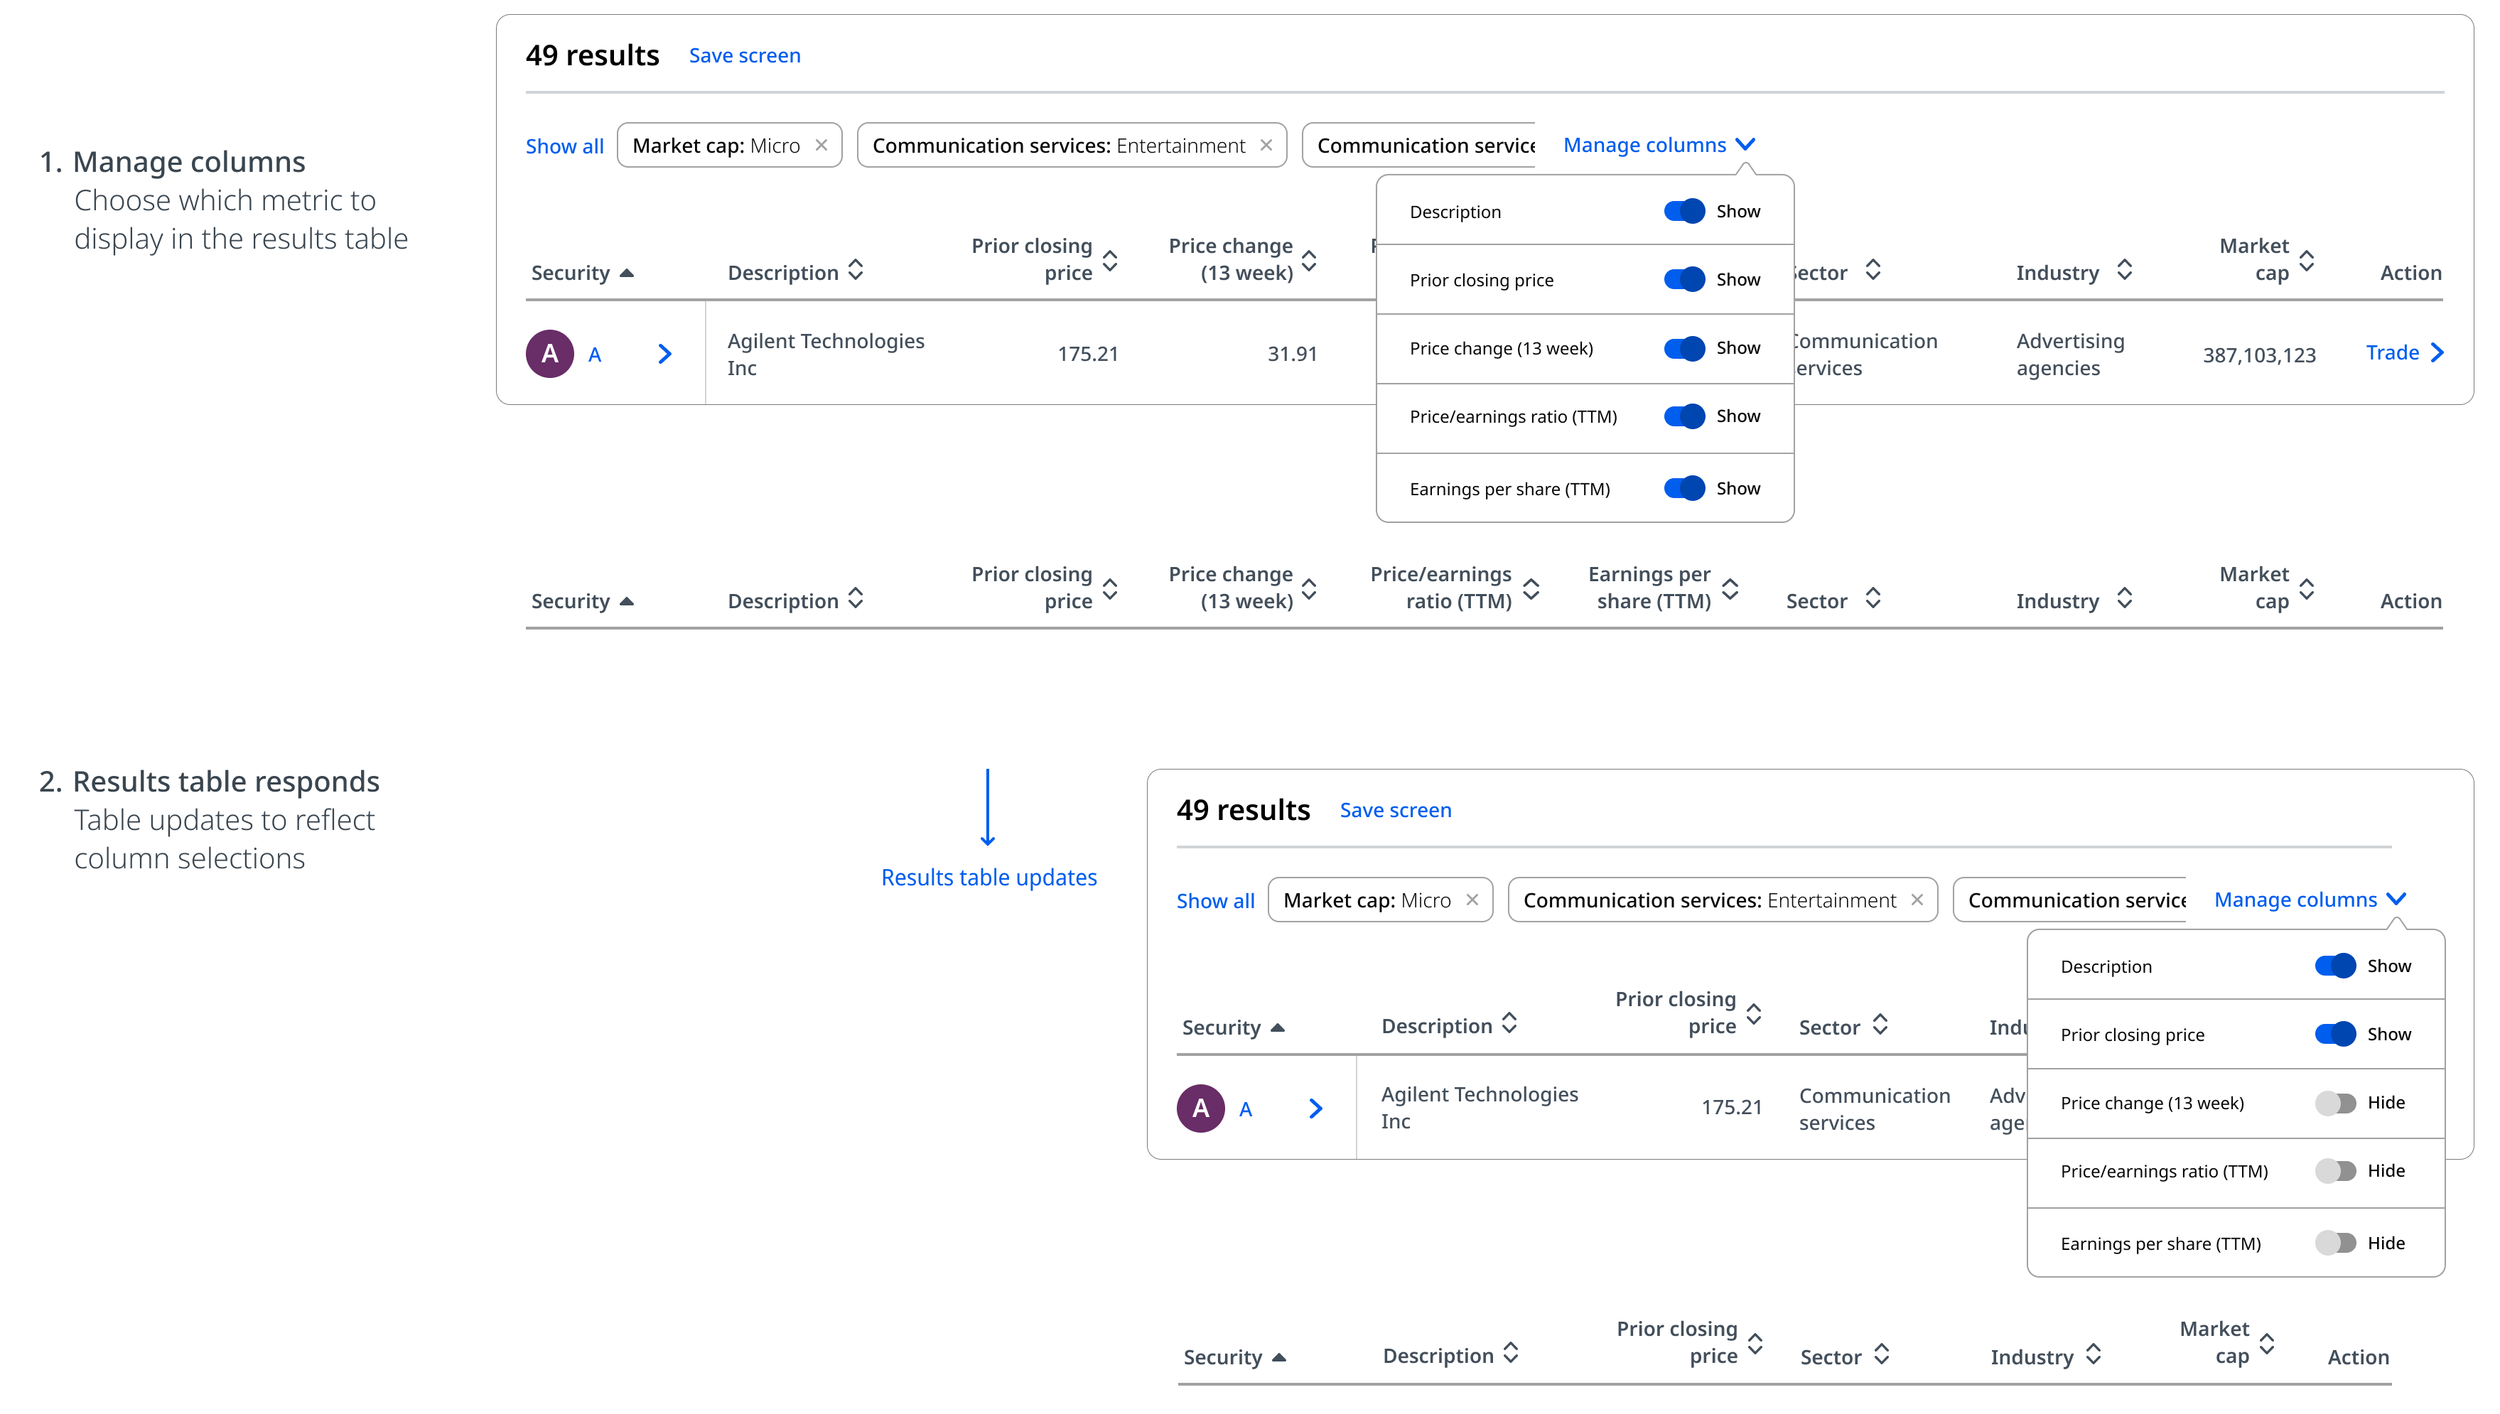
Applied filters appeared above the results table, where users could remove individual criteria, clear all filters, or return to adjust their selections. Each table displayed a predefined set of columns, with additional financial metrics available as users’ applied filters. The Manage Columns control allowed users to toggle default and filter-added columns on or off, configuring the data displayed for comparison. This gave investors greater control over how they refined results and evaluated investment opportunities.


Responsive Architecture and Cross-Platform Implementation

The screener leveraged Chase.com’s global twelve-column responsive grid and breakpoint standards, allocating three columns to the filter rail and nine to the results. On desktop, the results area expanded edge to edge when users collapsed the filter rail. On smaller screens, the table retained its full structure, with horizontal scrolling providing access to data columns beyond the viewport.

The screening experience was integrated into the native app through an iframe, supporting both portrait and landscape orientations. In portrait view, the filter interface appeared as an overlay, while the results table remained accessible through the [Results] control. Landscape orientation provided additional horizontal space for viewing the table and its financial data.

Project Reflection

The project demonstrated the value and importance of cross-functional collaboration. The partnership with Fincentric and Strategy was central to translating complex financial data and investment criteria into a standardized screening architecture.  

Developing the stock screener first established a framework that Engineering could extend to ETFs and mutual funds, while maintaining a consistent approach across the distinct asset classes. The new experience addressed key gaps and significant limitations of the legacy screener through expanded financial data coverage, filtering capabilities, investment comparison, and cross-platform access. The work established reusable UX/UI patterns and implementation approaches that extended beyond the screening product, strengthening alignment across platforms and providing a foundation for future investment experiences.